Dr. Claire McKinley is a Research Associate from the University of Washington. She is currently working and reporting on the research occurring along the Hikurangi subduction zone on board the US research vessel Revelle.
Mapping is the first thing we do at every location. We are mapping the ocean to locate bubbles, because bubbles will lead us to sites on the seafloor that have fluid flow, or seeps. We do this so when we take cores, measure heat flow and deploy instruments we know we are spending our time where we have confirmed there are seeps.
We use an instrument (Kongsberg EM 122 Multibeam sonar) that can measure the depth of the seafloor in 400 locations at once. It is essentially a very fancy fish finder that we use to look for bubbles in the water and features on the sea floor. There are transducers in the bottom of the ship, which are speakers that send sound to the bottom; on the ship we can hear this quiet chirping ping like a metronome. The speakers are paired with receivers that record when the sound bounces back off of bubbles or is reflected off the seafloor.
To pick the sites we survey locations where seeps have been identified by previous researchers. Some of the locations were imaged during seismic cruises like the recent one on the Langseth, but we also have a database of sites where seeps have been apparent over time. Seeps are common where there are faults or have been landslides so we also use the bathymetry or the shape of the seafloor to make estimates about where to look.
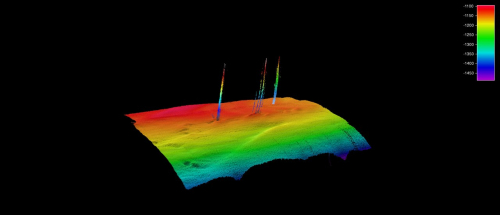
When mapping, we drive the ship back and forth like mowing a lawn. We can process the sonar’s data in real time and view the results to map the bathymetry in detail, and most importantly look at the water column for the signature of bubbles. The bubbles are strong reflectors and at seeps they appear in columns that reach from the seafloor up into the water column.
When we find bubbles, we get really excited, and we mark down the location. Then we look at the bathymetry and seafloor imagery to evaluate how hard the sea floor is, and if a location looks like it fits our needs, we move the ship over it and proceed to the coring phase of the operation. Ultimately, we also use the maps we have made to navigate around the seafloor with Jason, the remotely operated vehicle. In this case, the maps we create allow us to return to the same place on the seafloor during a Jason dive.
Image Caption: This is an example, generated by University of Washington Student Brendan Phillips, of what it looks like when we locate seeps on the seafloor, it was. The product of the mapping reveals bubbles rising out of the seafloor into the overlaying water.
Disclaimers and Copyright
While every endeavour has been taken by the East Coast Lab Hikurangi Subduction Zone M9 to ensure that the information on this website is
accurate and up to date, East Coast Lab Hikurangi Subduction Zone M9 shall not be liable for any loss suffered through the use, directly or indirectly, of information on this website. Information contained has been assembled in good faith.
Some of the information available in this site is from the New Zealand Public domain and supplied by relevant
government agencies. East Coast Lab Hikurangi Subduction Zone M9 cannot accept any liability for its accuracy or content.
Portions of the information and material on this site, including data, pages, documents, online
graphics and images are protected by copyright, unless specifically notified to the contrary. Externally sourced
information or material is copyright to the respective provider.
© East Coast Lab Hikurangi Subduction Zone M9 - www.eastcoastlab.org.nz / +64 6 835 9200 / info@eastcoastlab.org.nz